Sales analysis
Sales analysis
This "Sales analysis" report visually breaks down your sales performance across different time intervals, such as "2:00 PM - 3:00 PM" and "7:00 PM - 8:00 PM." For each interval, you can see the "No. of Invoices" and the "Average Value" of sales. This helps you identify peak sales periods and customer activity patterns.
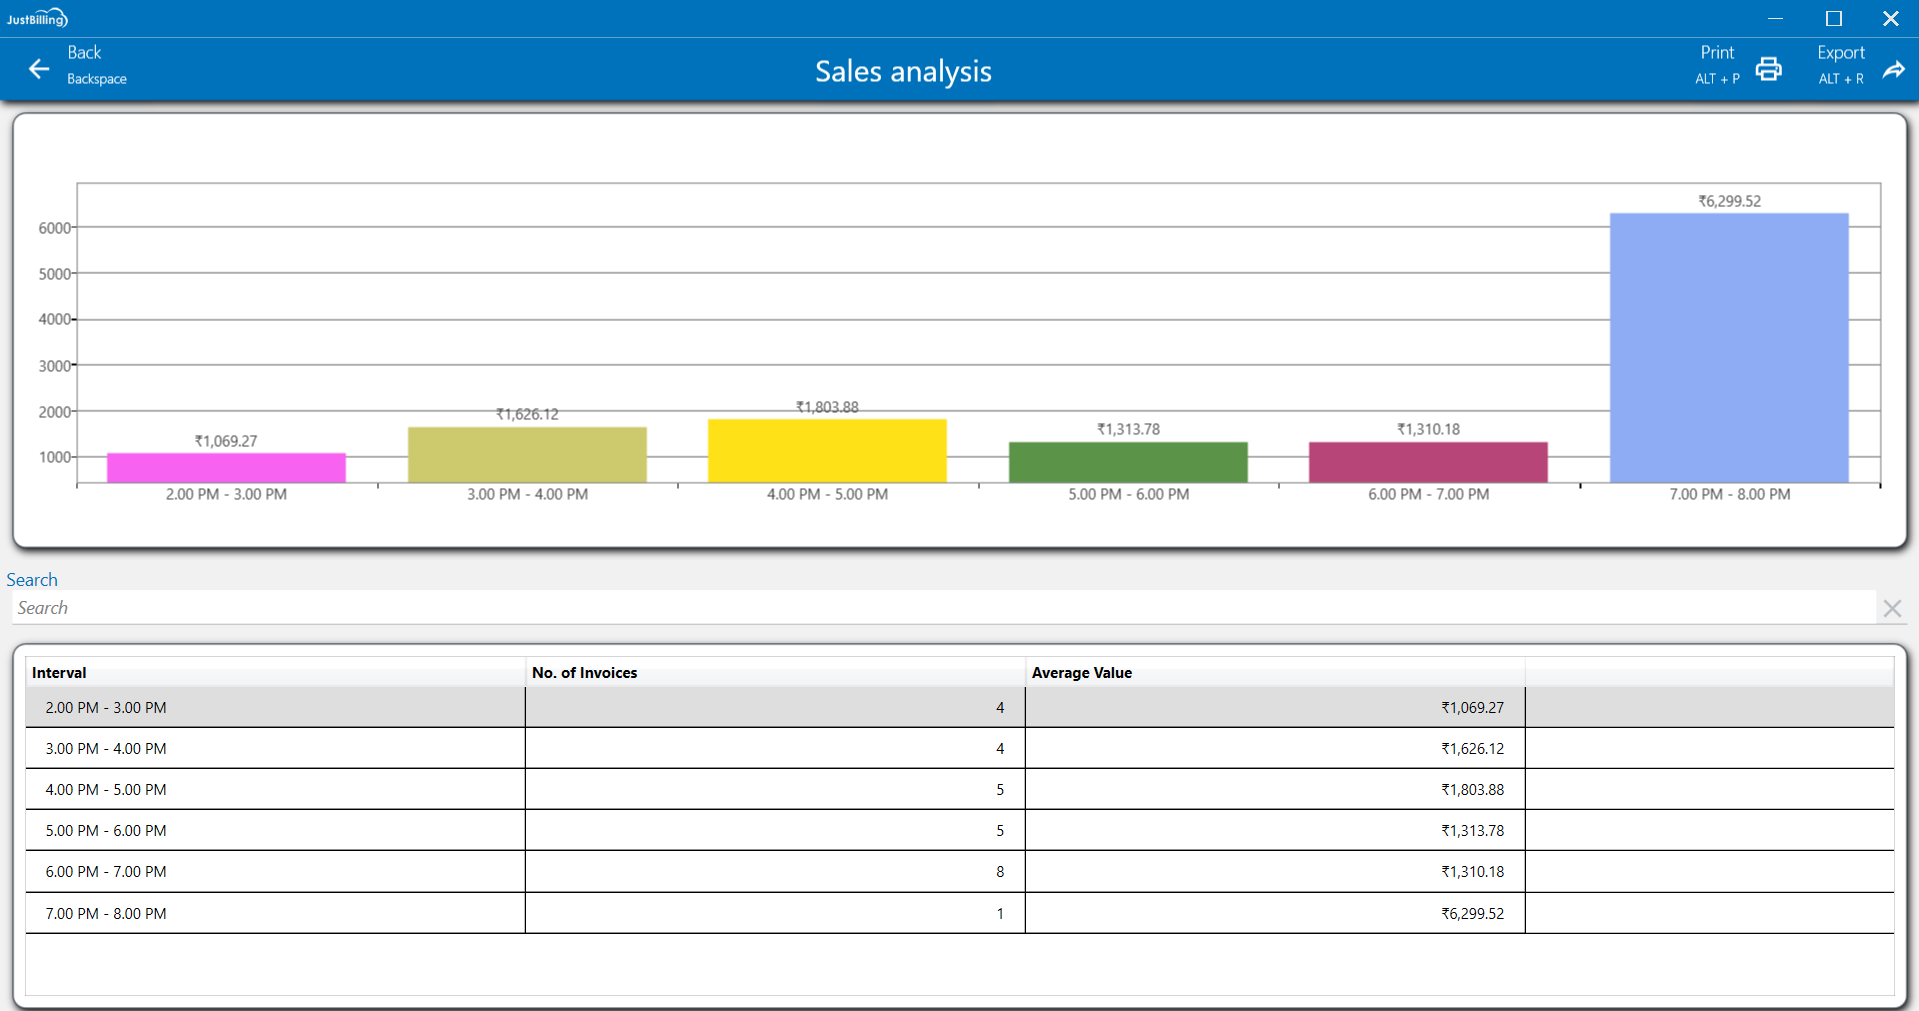
(Figure 1 - Sales analysis Report)
From this report users can see the total sales made in a day.
Customize layout: You can customize the layout by expanding column sizes and moving columns to your preferred order and right click on the column to get personalized options.(See figure below)
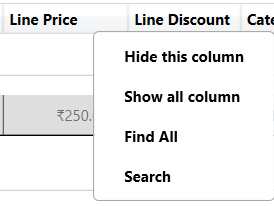
(Figure 2 -Customize layout)
Filter: To refine the report view, click on the Filter option located in the top-right corner of the screen. You can then select a particular date range to narrow down the displayed data. This functionality allows you to focus on a specific period, making it easier to analyze and find the transactions you need.
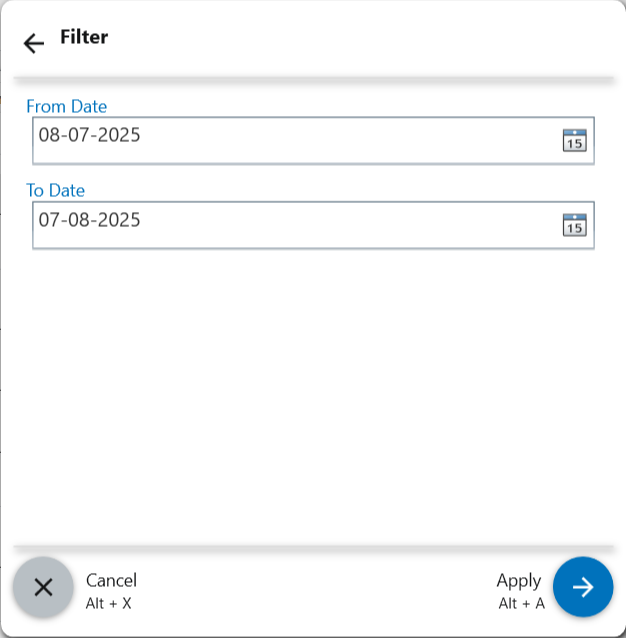
(Figure 3 - Filter report data)
Print: Click on the Print option to create a physical copy of this detailed report.
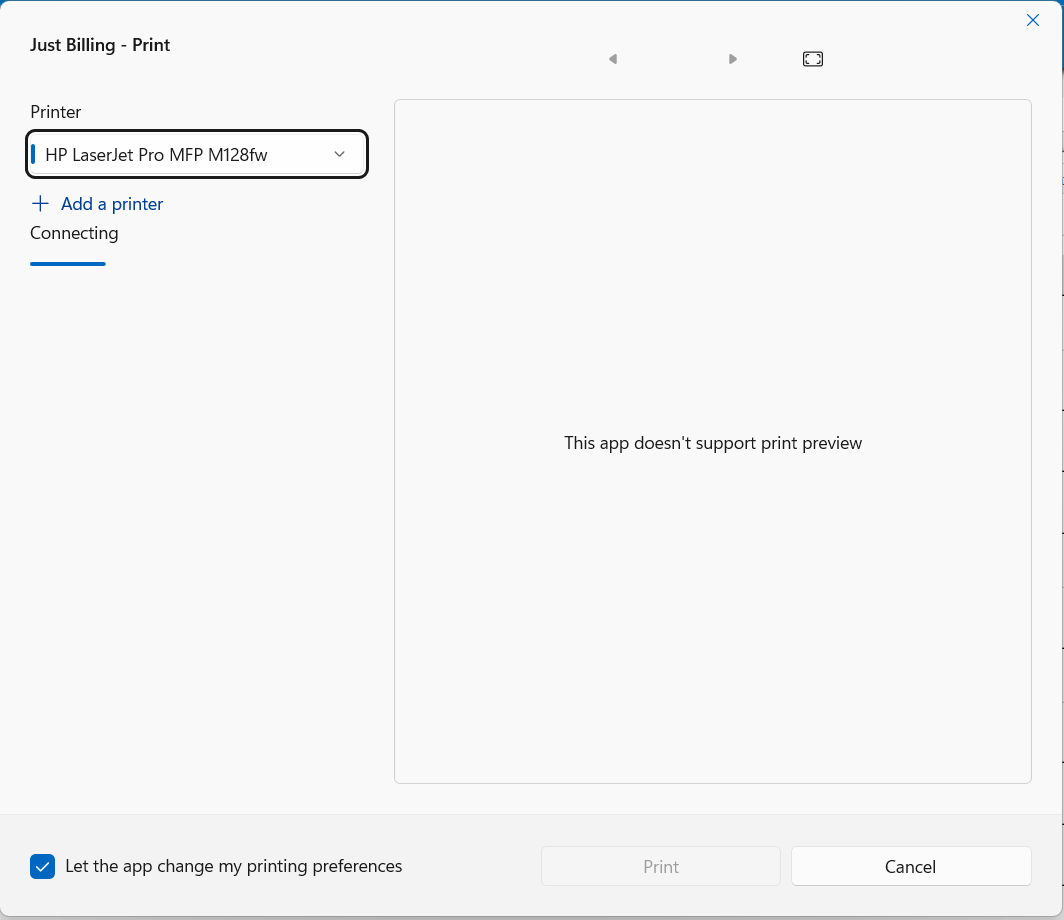
(Figure 4 - Print Report)
Export: To save the report, click the Export option. You can then choose to export the data to an Excel file or as a PDF document for easy sharing.
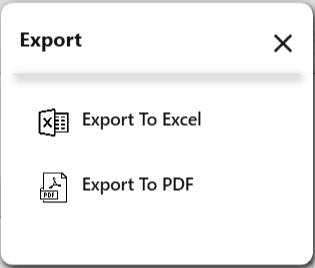
(Figure 5 - Export Report)