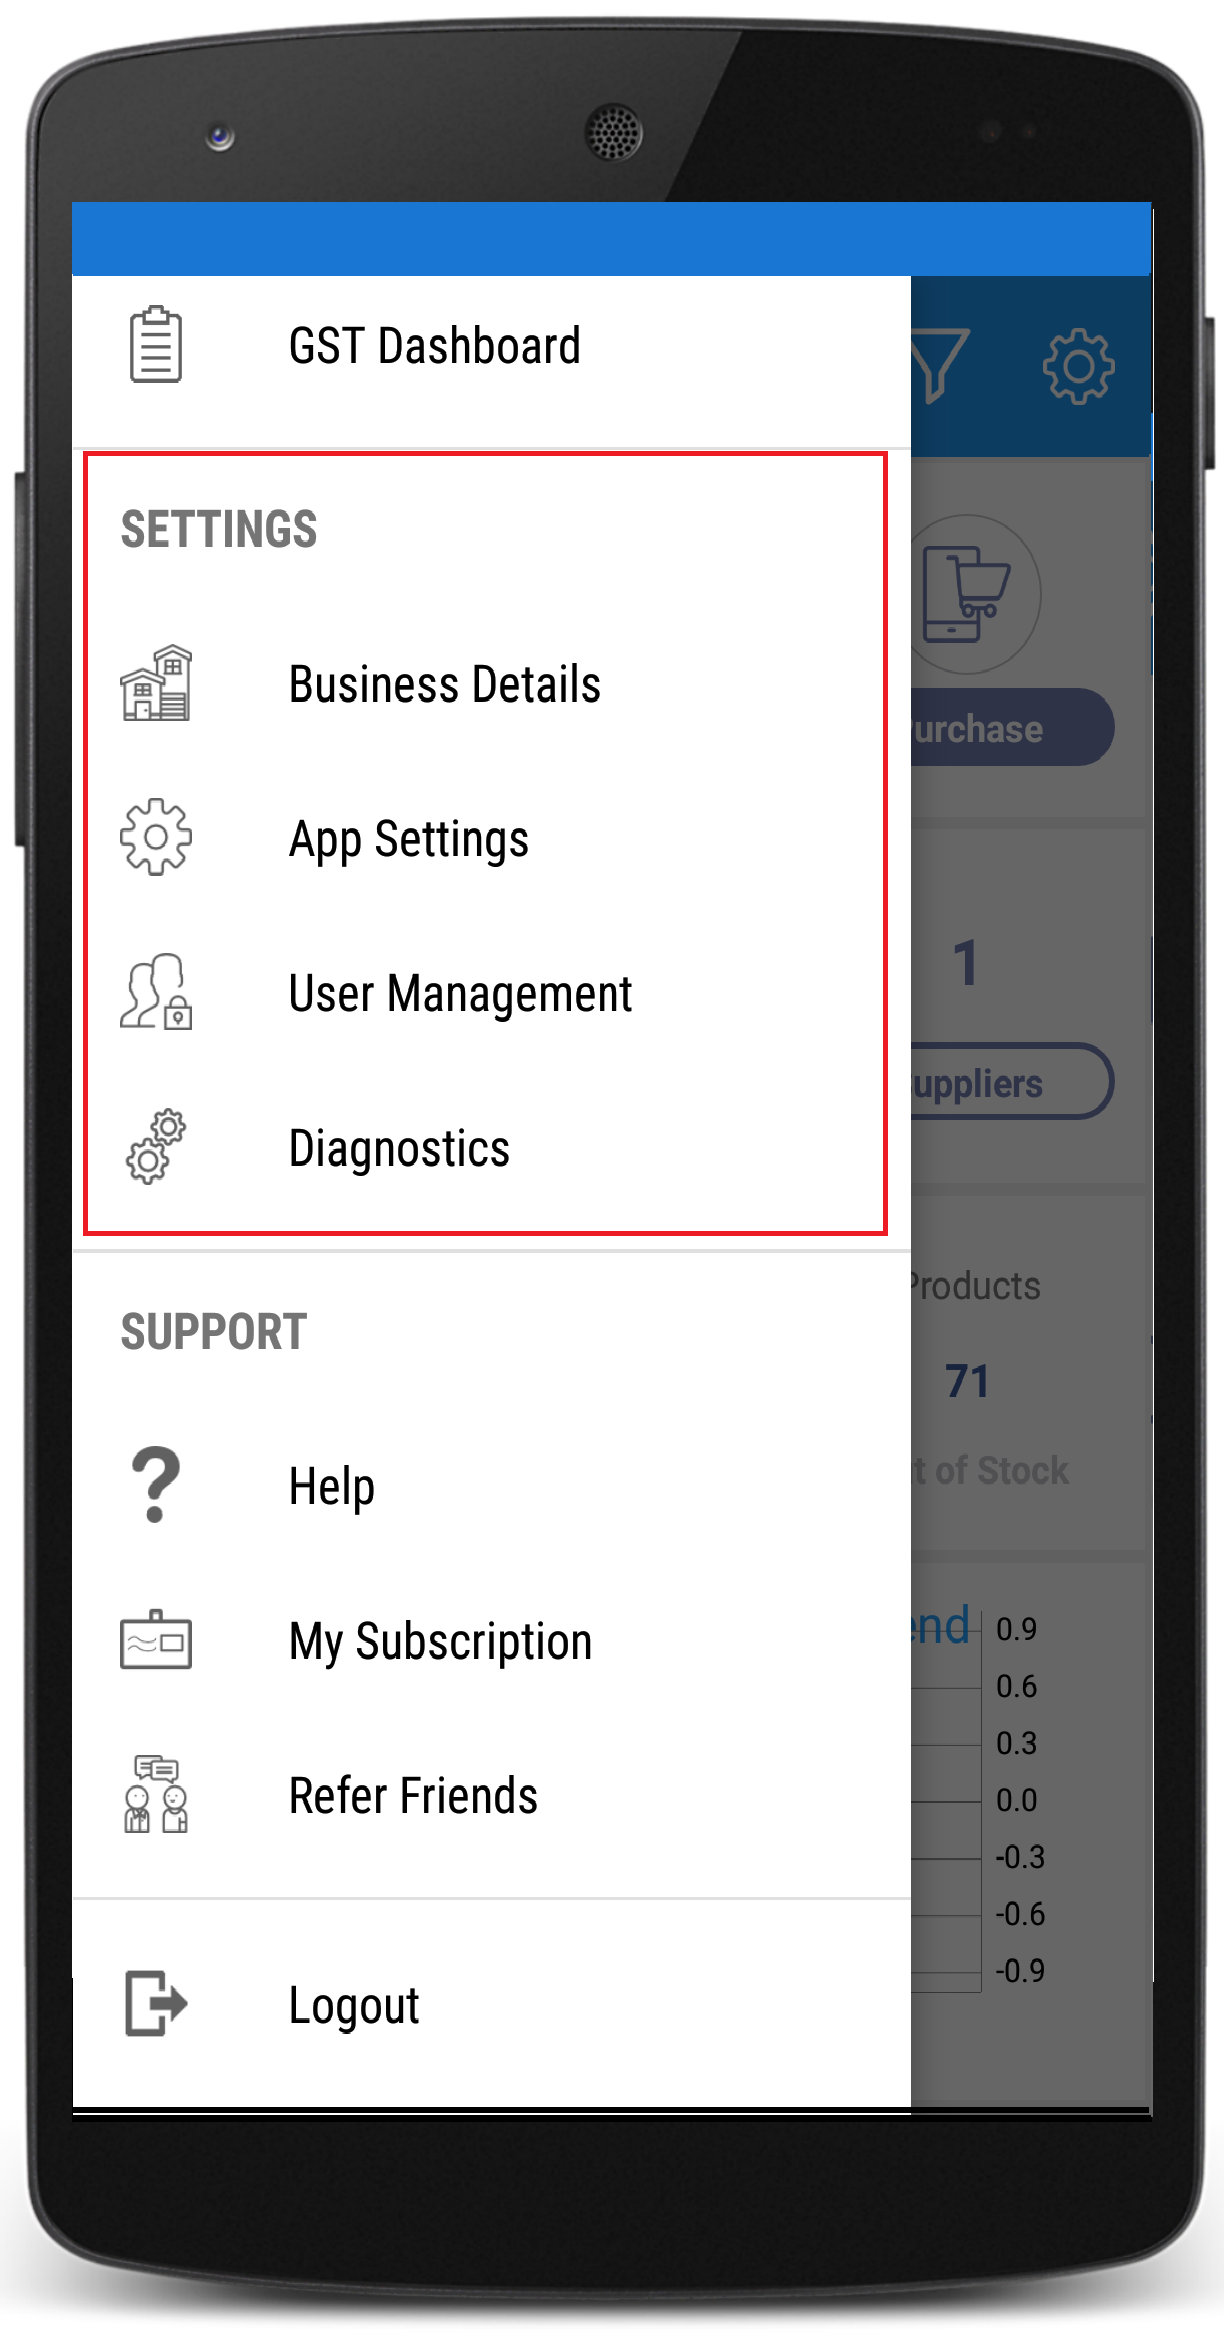
Hourly sales
Hourly sales
The Hourly Sales Report presents sales data segmented by each hourly time slot throughout the day.
It displays the number of invoices and total sales amount per hour using a bar graph and a detailed list below.
This report enables businesses to identify peak and low-performing hours to optimize staffing and sales strategies.
(Figure 1 - Detailed Hourly sales Report)
Filter: To refine the report view, click on the Filter option  located in the top-right corner of the screen. You can then select a particular date range to narrow down the displayed data. This functionality allows you to focus on a specific period, making it easier to analyze and find the transactions you need.
(Figure 2 - Filter report data)
When you tap this icon  , it provides you the options to Print or share the report. If you choose to share, it shows sharing options on your device.
Print: Click on the Print option to create a physical copy of this detailed report.
(Figure 3 - Print Report)
Share: To Share the report, click the Share option. You can then choose to share to your contacts as a PDF document.

(Figure 4 - Share Report)